
Server Insights
If you're someone who helps run a Community Server with more than 500 members, you may have seen a new permission pop up in your server settings: View Server Insights. Server Insights is a new experimental feature from Discord that gives you visibility into how your server is doing. Is it healthy? Are people talking? What's your retention look like? These are all questions that were hard or impossible to answer before. Now, they're easy, and come in pretty charts!
Quick note: Server Insights is an alpha feature, so there may be bugs!
Accessing Server Insights
The ability to view this information is behind a new permission: View Server Insights. Granting someone in your server that permission will unlock the feature for them. Once unlocked, you can access Server Insights in a number of ways:
1. From the server settings dropdown
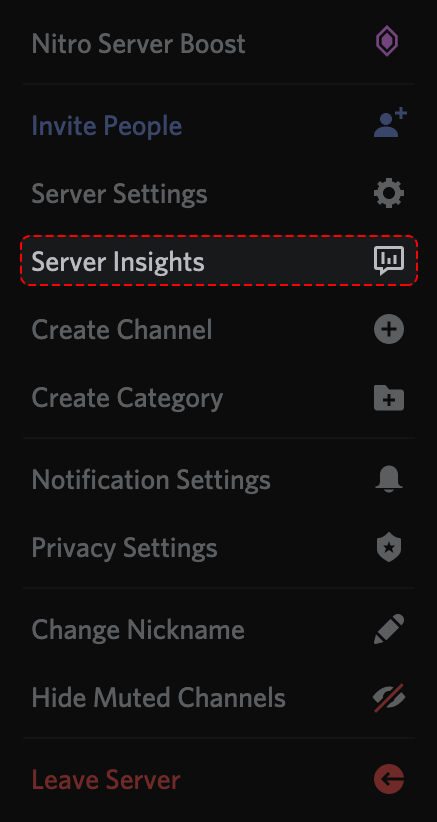
2. Within your server's settings
3. At https://discord.com/developers/servers There, you'll see a list of servers in which you have permission to see insights.
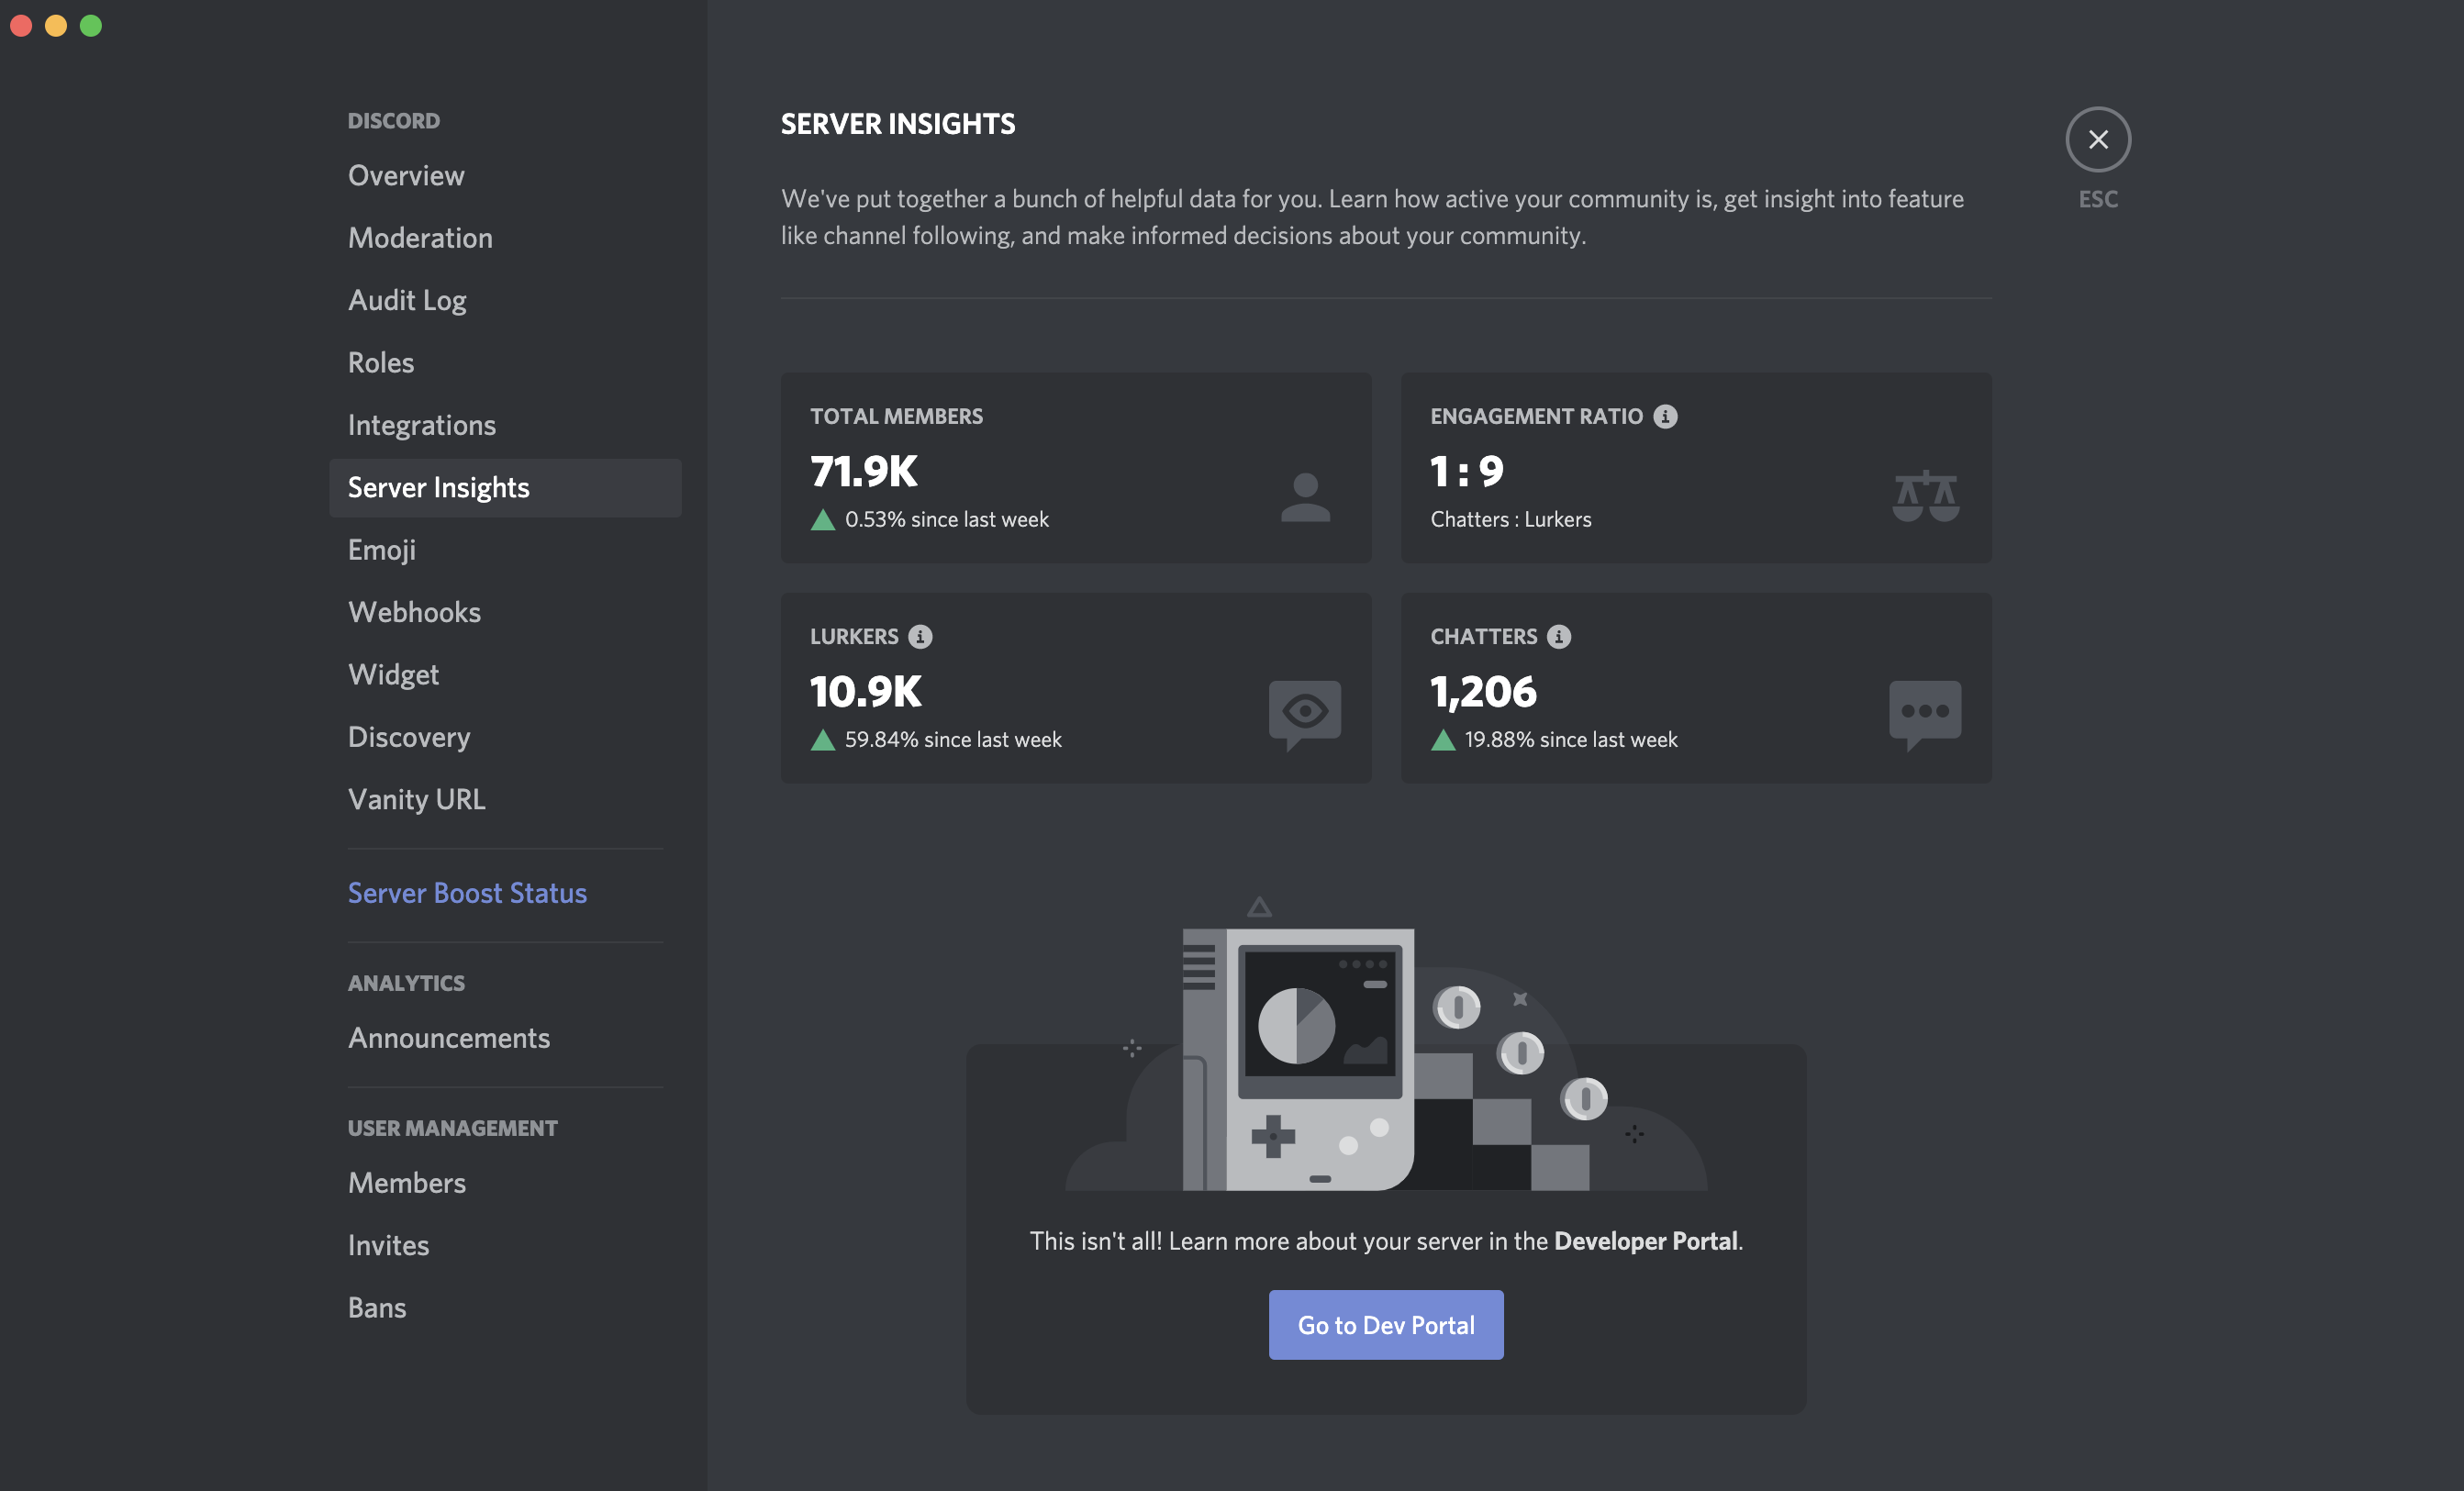
What’s available
Growth and Activation: Where are new members coming from? Are they able to successfully talk? How many of them retain?
Engagement: What are my members doing? How many people are talking? Which channels do people use the most?
Audience: Where are my members from? How long have they been in my server?
Announcement Channels: Analytics for your Announcement Channels (if enabled). Learn more about Announcement Channels here.
Welcome Screen: Analytics for your Welcome Screen (if enabled) Learn more about Welcome Screen here.
Privacy
Your privacy comes first. That's why, along with aggregating and anonymizing what's shown in Server Insights, we've taken additional precautions to ensure that individual server members cannot be targeted.
For example, let's say you have a server with 100 members. No one from that server is located in the United States, so that country does not appear in your country breakout. The 101st member joins, and they are from the United States. How do we make sure that person can't be targeted as being from the United States?
We do it like this, for a number of charts:
- Referrers: When you choose a date range for this chart, we calculate how many users joined your server from each referrer. Any referrer that has less than 50 joiners for the given time range will be combined into "Other" along with other referrers with less than 50 joiners.
- Country Breakouts: For the given time range, if any country is represented by less than 50 members, those members will be bucketed into the "Other" category along with members from any other countries with less than 50 representatives.
- Device Breakouts: For the given time range, any of the three categories—desktop, mobile, mixed—with less than 50 members will not be shown.
If you do not wish your activity in a Discord server to be included in Server Insights, you can opt out at any time by turning off this toggle in your account settings.
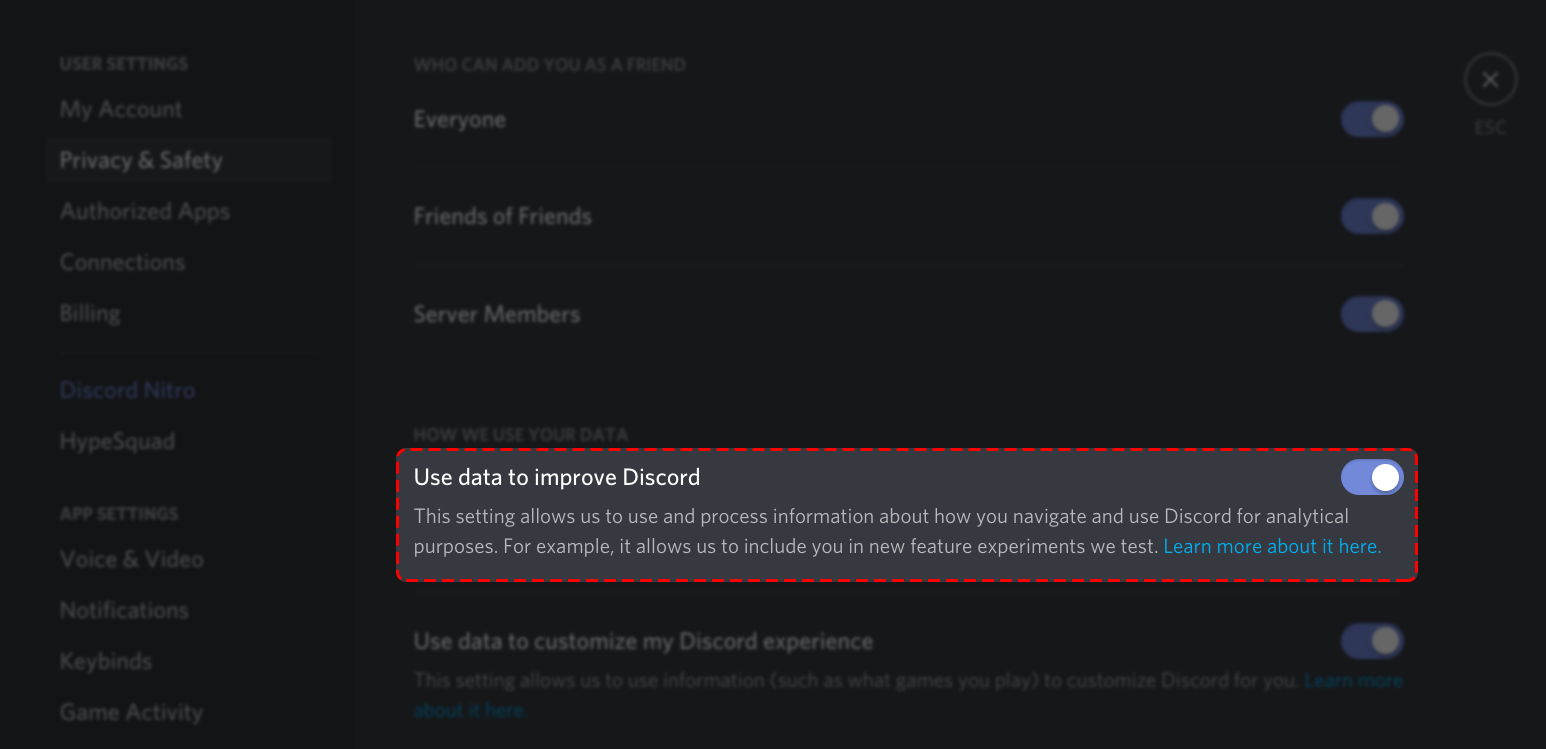
Users that post in the Announcement Channels will need to have Use data to improve Discord enabled in order for their announcement stats to show up in Server Insights’s Announcement Channel section.
Availability
Server Insights are up-to-date as of one day in the past and will go as far back as 120 days for non-Partner and Verified servers. In some charts, it may not go back as far, as some data are only available starting from the day your server reached 500 members.
For Partner and Verified servers, data can go back beyond 120 days, specifically, it will go back to the point at which your server was Verified or Partnered. So, if you got Partnered on May 1, 2018, you'll see charts starting on May 2, 2018.
All dates and date ranges are represented in international UTC time. If you need help converting your timezone to UTC, here's a website.
Finally, we only show completed days, weeks, or months. This means that if you've selected Weekly or Monthly as your interval, and your starting date doesn't line up with the start of a week or month, you may miss some info.
Dashboard Interactivity
- Interval: These charts can be aggregated in three different ways: daily, weekly, and monthly.
- Hourly will be coming soon!
- Date Range: You can specify a custom date range for the charts. This lets you view wide breadths of historical trends, or hone in on a very specific day.
- Export CSV: You can export charts to CSV
- Sorting: Tables with columns with numerical amounts can be sorted ascending or descending
You Are Now Prepared
That's it! You've learned it all! You can come back to these charts at any time to see how your server is doing. We highly encourage you to experiment with ways to improve your server, now with the power to actually measure the impact.